
Lucid’s recovery case has a more concrete foundation when progress is measured through cash discipline and the ability to fund the next stage of product development. The opportunity is substantial if better execution turns engineering investment into a stronger commercial business, while the recent results provide specific measures for testing that progress.
Lucid (LCID) is a current Bull Portfolio holding, selected for identified short-term growth potential. The portfolio became effective on November 9. Its inclusion reflects a research selection around recovery potential; it does not imply that production growth, profitability or a higher share price is assured.
Key takeaways
- Lower cash consumption gives the recovery thesis a measurable checkpoint.
- Financing supports execution but does not eliminate losses.
- A low annual-range position needs confirmation from business progress.
Better execution can increase the value of future growth
An electric-vehicle manufacturer must connect product appeal with manufacturing efficiency, deliveries and cash generation. A promising vehicle alone does not settle the investment case. The more useful question is whether the company can scale its commercial activity while reducing the financial cost of reaching that scale.
This gives Lucid several observable research checkpoints. Investors can evaluate the pace of cash consumption, the relationship between production and demand, and the milestones required for the next product stage. Progress on those measures can strengthen confidence before the business becomes profitable, provided the improvement is material and repeatable.
The November 9 earnings release reported approximately $350 million of Q3 revenue and a 30% sequential reduction in free-cash-flow consumption to $1.04 billion. Quarter-end liquidity was $2.0 billion, or $3.75 billion pro forma for an expanded $1.75 billion financing facility. Management expects that funding to support operations into Q4 2027. That is a company expectation, not a guaranteed runway or cash already earned from vehicle sales.
Improving cash discipline and continuing losses can coexist
The retained revenue sequence is $522.730 million, $282.465 million, $405.347 million and $350.319 million from Q4 2025 through Q3 2026. That history is uneven rather than a smooth expansion. It makes the operating improvement story more dependent on execution than on a simple extrapolation of recent sales.
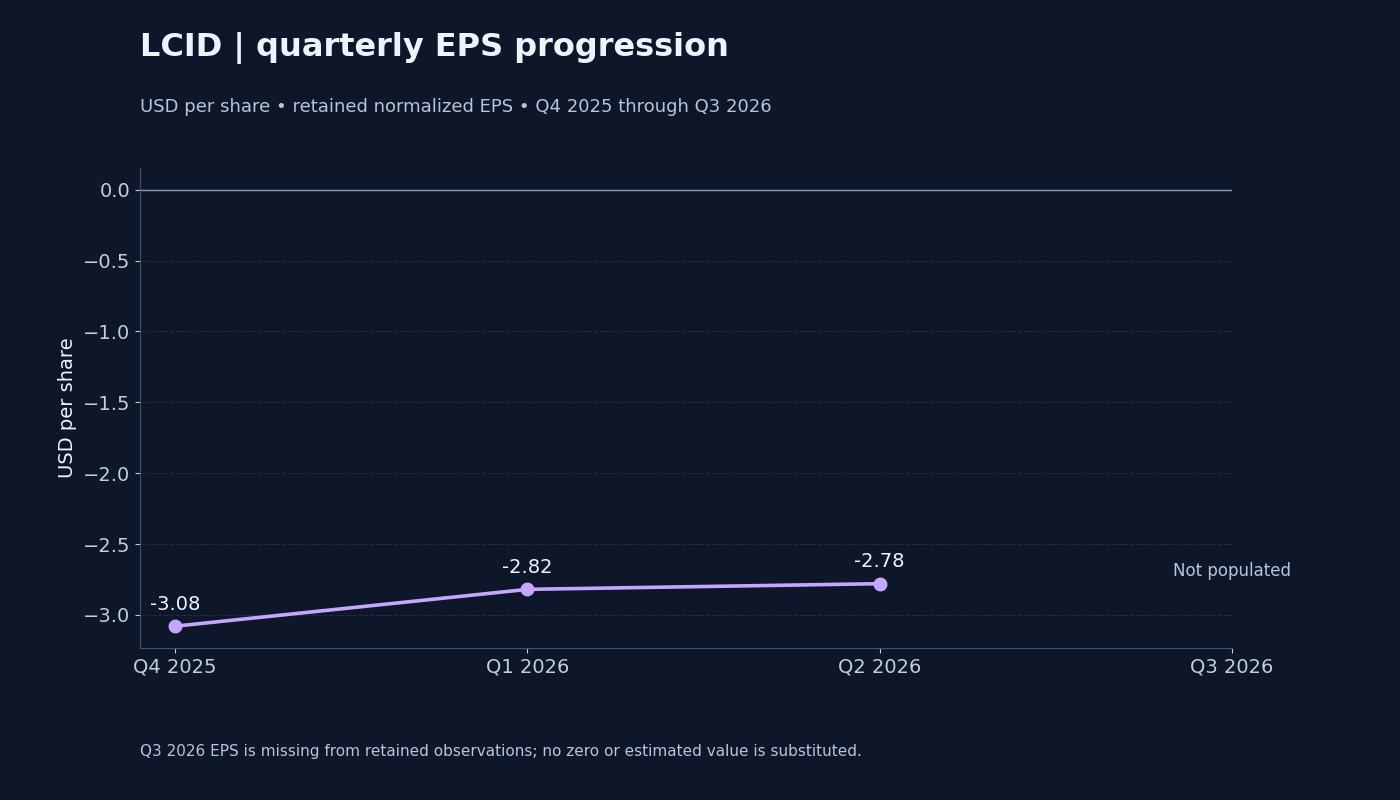
The retained normalized EPS sequence contains minus $3.08, minus $2.82 and minus $2.78 for the first three displayed quarters. The September-quarter EPS observation is not populated, so the chart preserves that gap. The company has already released Q3 results; a missing platform EPS observation is not presented as an unreleased quarter, a zero or an estimated earnings figure.
The constructive reading is that a company can improve its cost and cash trajectory before it produces positive earnings. The limit is equally clear: a smaller cash outflow still consumes funding. Future assessments should therefore examine the rate of improvement, the remaining investment program and the conditions attached to financing, rather than interpreting additional liquidity as profitability.
Price progress and the room for confirmation
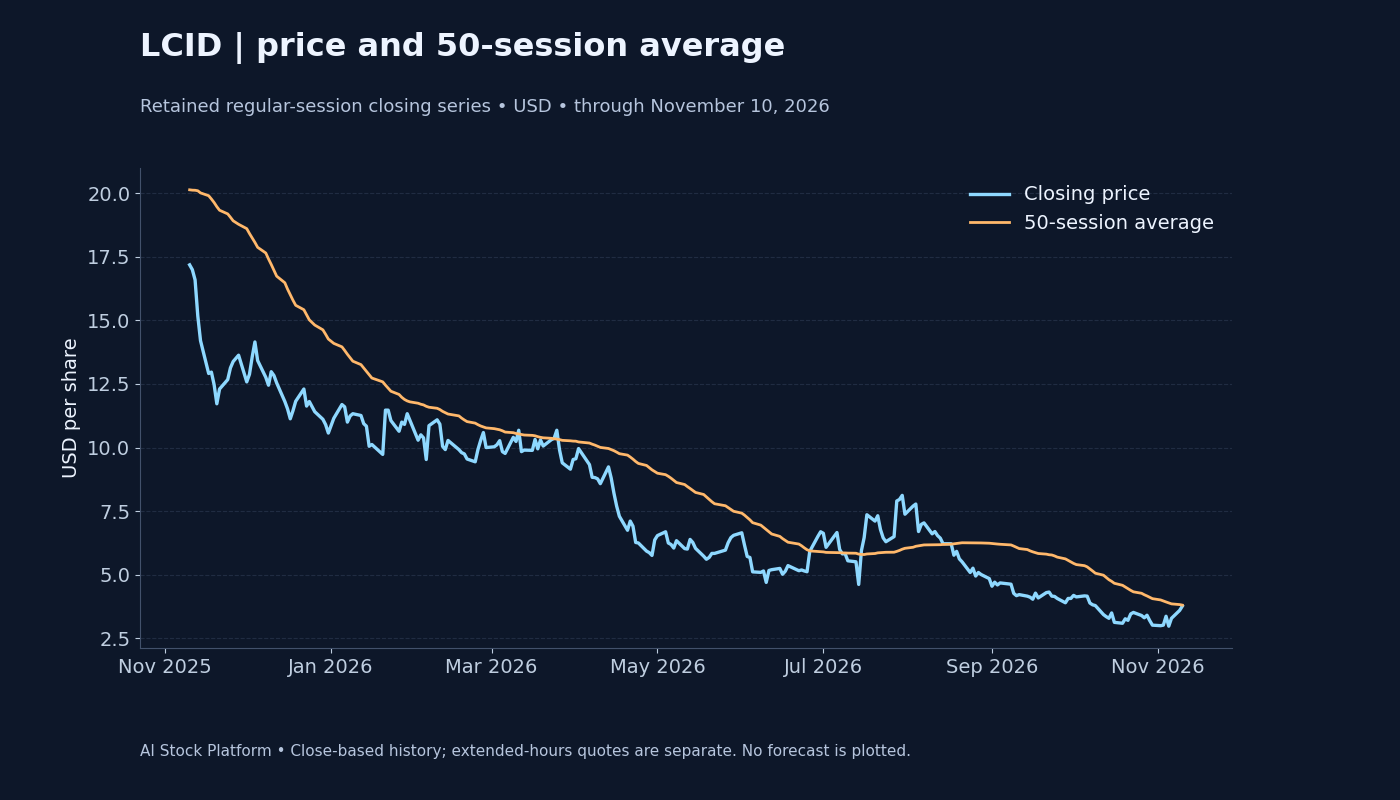
The latest exchange premarket quote was $3.7708, +0.02%, at Nov 11, 2026 4:15 AM ET. Early-session trades can occur on limited volume and are separate from completed-session returns. The platform’s retained November 10 closing series records $3.77, a +4.72% daily change and a +24.83% five-session return. The price chart and all historical comparisons use that same retained series.
The annual closing-price range is $2.98–$17.18, placing the latest retained close approximately 5.6% of the way from its low to its high. This is a range position, not the one-year return, and it differs from an intraday 52-week high/low. The 50-session average is $3.81; the close stands -0.97% relative to it.
LCID sits close to the bottom of its annual closing range and only slightly below its 50-session average. That offers a different setup from a share already stretched far above its trend. A lasting recovery would need the improving weekly price action to develop into sustained support, accompanied by stronger business delivery.
Three signals ask different questions
The current Price Score is 4.32/5, Momentum V3 is 44.61/100, and AI Score is 2.43/5. Price Score describes a recovery-oriented setup, including weekly return, distance from the moving average, industry sentiment, annual-range position and rank movement. It is not a business valuation or an analyst recommendation.
Momentum V3 changed by -1.10 points between the November 9 and November 10 price-feature observations. The AI snapshot is dated November 11, while the Price Score and momentum features refer to November 10. Different scores can disagree because they measure different things; no model probability or price target is inferred from these readings.
The platform’s 20-stock illustrative industry index shows a +2.71% five-session move and stands +6.51% relative to its own 50-session average. That describes the broader group’s backdrop, not this company’s return. A stronger business case is easier to sustain when company delivery and industry participation reinforce each other.
Rivian and Tesla provide electric-vehicle reference points, with different scale, products and business economics. Current platform Price Scores are 3.32 for RIVN and 2.80 for TSLA, compared with LCID’s 4.32. Their Momentum V3 readings are 47.68 and 53.86, versus 44.61 for LCID. The contrast illustrates why a high recovery score can coexist with weaker established momentum.
The recovery has measurable milestones
The positive drivers are improved cash discipline and greater financing flexibility. They would become more persuasive if the company continues to reduce the funding required for each stage of commercial development. A stronger market response is more sustainable when supported by customer demand and improving operating efficiency.
The main inhibitors are persistent losses, execution delays and potential dilution or financing constraints. Management’s funding expectations should be reassessed as spending and delivery evolve. The growth case remains constructive as a recovery opportunity, with the strongest confirmation coming from repeated financial improvement and a share price that builds support rather than relying on isolated rebounds.