
Micron’s Friday rebound is encouraging, but the more useful finding is the gap between its expanding earnings and its damaged share-price trend. At 10:17 a.m. EST on November 6, the stock was $697.64, up 6.28% from Thursday’s $656.39 close, according to Nasdaq’s quote service. That recovers some lost ground; it does not erase Thursday’s 17.46% decline or the preceding week’s weakness.
- The operating case rests on substantial revenue and earnings growth, not simply a lower share price.
- The stock remains well below its 50-day moving average despite Friday’s recovery.
- The next confirmation must come from sustained demand, cash generation and a less fragile trading pattern.
A strong business can still have a weak stock
Micron supplies memory and storage used in computing systems. Its exposure differs from that of a processor designer: customers need memory capacity and bandwidth alongside the chips doing the calculations. That makes AI infrastructure an important demand opportunity, while retaining the pricing and manufacturing risks of a capital-intensive semiconductor business.
The latest completed fiscal year offers a substantial operating foundation. In its September 30 results release, Micron reported fiscal Q4 revenue of $54.23 billion and GAAP net income of $37.70 billion. GAAP diluted EPS was $32.87, while adjusted EPS was $33.42. The fiscal year ended September 3; the quarter labels below are fiscal labels rather than exact calendar-quarter closing dates.
Management’s fiscal Q1 2027 revenue outlook was $61.5 billion, plus or minus $1.5 billion. That is guidance, not a reported result. The business question is whether the company can deliver that next step without sacrificing the economics that made the latest quarter so profitable.
What the financial trend adds
The platform’s four-quarter sequence shows revenue rising from approximately $13.64 billion to $23.86 billion, then $41.46 billion and $54.23 billion. Recorded quarterly earnings increased alongside sales, while the associated net margin expanded from roughly 38.4% to 69.5%. This is a much stronger pattern than revenue growth accompanied by shrinking earnings.
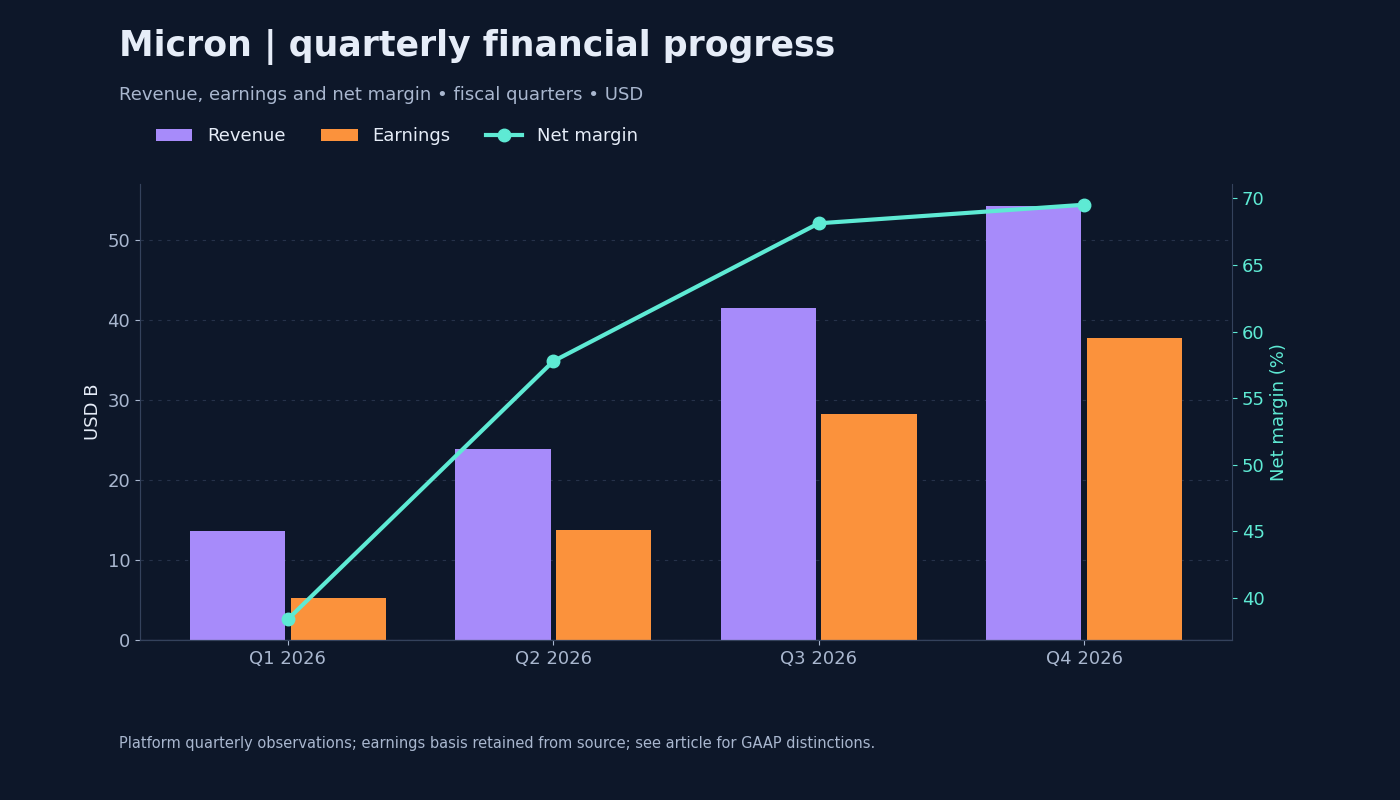
The recorded normalized EPS sequence is $4.78, $12.20, $25.11 and $33.42. Those figures belong to the adjusted series; they should not be substituted for GAAP diluted EPS. Nor should the latest quarter be multiplied by four and treated as a dependable annual earnings forecast. A rapidly improving cycle can make that shortcut especially misleading.
There are two supports for the operating thesis: expanding sales are reaching earnings, and the next-quarter outlook implies continued demand. The corresponding risks are that customers slow purchases after building capacity, or that additional investment produces less attractive returns as conditions normalize. Strong recent margins raise the importance of checking sustainability rather than assuming permanence.
Friday’s bounce has not repaired the chart
Through November 5, Micron had fallen 29.74% over five trading-session intervals. Its recorded 50-session average was approximately $966.54. Friday’s quoted price was still about 27.8% below that reference. A large positive daily percentage can therefore coexist with a clearly weakened intermediate trend.
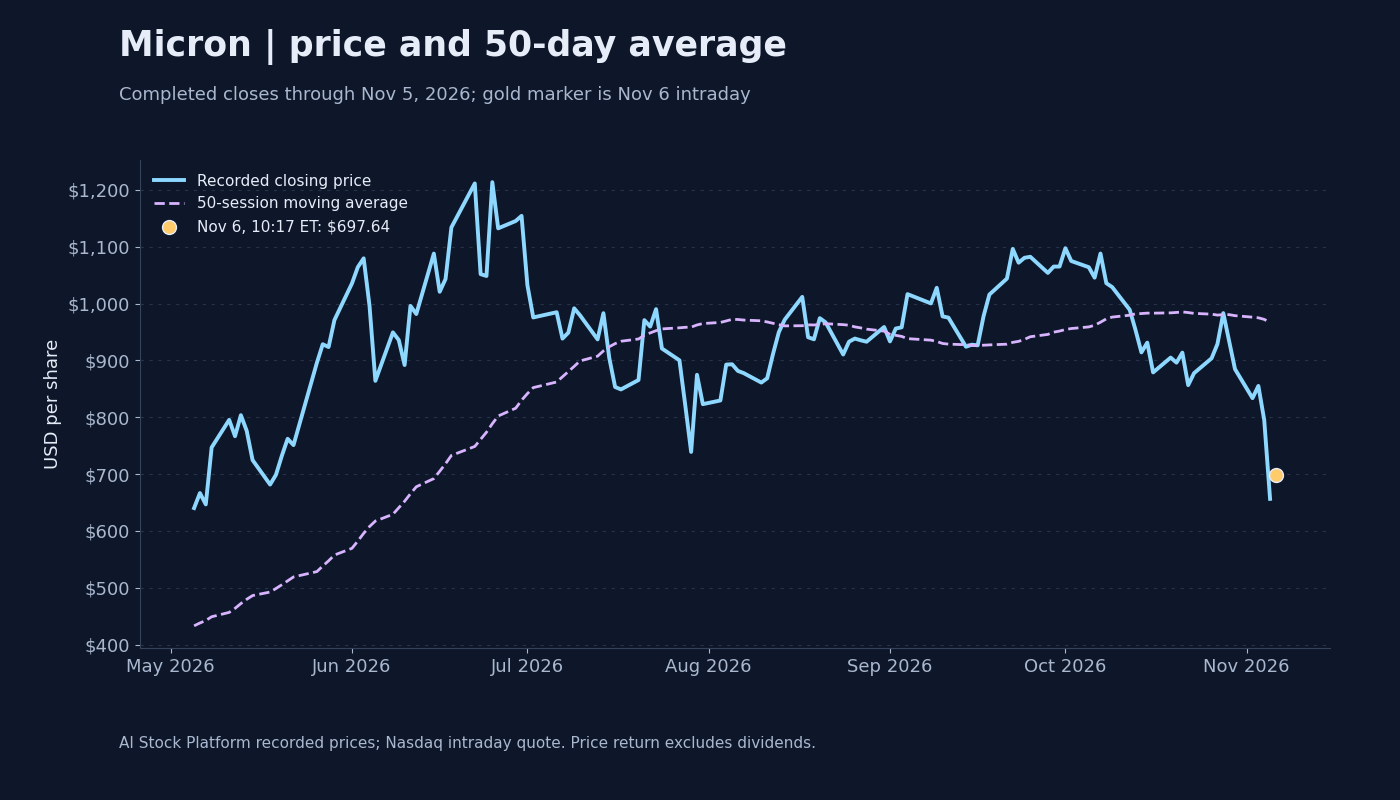
The platform’s one-year closing-price range was $201.37 to $1,213.56. The live quote stood around halfway up that range. This is a closing-price range, distinct from an exchange’s 52-week intraday high and low. Micron is far below its recent peak, but describing it as near its annual bottom would overstate the case.
For a short recovery thesis, the useful observation is whether buyers defend gains on subsequent sessions. A temporary rebound that repeatedly loses its opening strength would offer less confirmation than several closes that stabilize and begin narrowing the distance from the average.
Why the ratings remain restrained
The November 5 Price Score was 2.28/5, labeled Weak. It was unchanged from the preceding session. The current formula rewards a lower position relative to the 50-DMA, but also considers weekly returns, industry sentiment, annual-range position and rank movement. Being deeply below the average does not automatically produce a high overall score.
Momentum V3 fell from approximately 49.96 to 48.28 on its 0–100 scale. The latest model snapshot’s AI Score was 2.39/5. These are different signals: momentum describes price behavior, while AI Score is a broader model assessment. Neither is an analyst price target or a probability of making money. Today’s rebound has not yet been incorporated into those completed-session comparisons.
The industry backdrop also argues for patience. The platform’s semiconductor research index fell 12.71% on November 5, with four industry stocks advancing and 90 declining among those with available comparisons. That breadth suggests Micron’s weakness was not isolated. The index is a research illustration, not an investable benchmark.
Peers and the next decision point
AMD and Nvidia provide useful AI-infrastructure context, though neither is a direct substitute for Micron’s memory economics. Their completed-session Momentum readings were approximately 46.96 and 54.36 respectively. That dispersion matters: participation in the same spending theme does not guarantee the same price trend or exposure to pricing pressure.
No newly announced earnings-call date is treated as confirmed here. The next operating checkpoint is delivery against fiscal Q1 guidance and evidence that margin strength survives continued expansion. The near-term assessment is mixed: improving business results support the longer argument, while weak breadth and a distant moving average leave the stock’s recovery unconfirmed. Sustained closes and durable earnings would strengthen the case; renewed selling alongside weaker demand would undermine it.