
TOP Financial’s expansion into lending and technology services gives investors a concrete growth story to investigate. Selected for this research series because of identified growth potential, TOP combines a changing business mix with strong recent price momentum. Its position near the upper end of the annual range makes the quality and scale of future earnings especially important.
Key takeaways
- Lending and technology services broaden the business opportunity.
- The share price has already made a substantial move toward its annual high.
- Revenue scale, cash generation and dilution determine how much growth reaches each share.
A broader financial-services business is taking shape
TOP operates brokerage and related financial-services activities through regulated subsidiaries. Its opportunity extends beyond transaction commissions as management develops lending and technology services. A broader product set can deepen customer relationships, although each activity introduces its own operating and regulatory requirements.
The September-quarter filing provides a useful starting point. Revenue reached approximately $2.21 million, compared with $1.54 million a year earlier. Quarterly net income was approximately $0.27 million. Over six months, revenue was $3.29 million and net income approximately $0.16 million. The quarterly improvement is encouraging, while the small absolute earnings base makes execution important to valuation. TOP Financial September filing
AI services generated approximately $0.22 million of revenue in the period, while net loans receivable reached about $99.7 million. Six-month operating cash flow used approximately $2.39 million. These figures show why the growth thesis needs to include lending quality, funding and collection alongside the technology opportunity. Business mix and cash flow
A larger loan book can produce more interest income, but it also ties capital to counterparties. Technology services can add revenue streams, while customer acquisition and delivery costs determine their contribution. Investors can follow those activities separately before concluding that a broader business mix has improved overall profitability.
Expansion needs to translate into value per share
Management has described a U.S. headquarters in Houston and plans for an AI research-and-development presence in Silicon Valley. Those plans give the company a strategic direction. Their investment value depends on funded execution, customers and financial contribution as the initiatives develop. Company business update
On November 3, TOP also said it was unaware of material undisclosed developments explaining recent unusual price fluctuations. That statement helps separate the disclosed business expansion from assumptions about the cause of every market move. Friday’s gain should therefore be treated as observed trading behavior, with attribution limited to what the company has confirmed. Statement on unusual trading
The platform’s canonical quarterly EPS and financial-chart coverage remains incomplete for TOP. This article uses the directly verified filing for the financial discussion and a single factual price chart. A continuous earnings chart would require compatible quarterly observations and verified share-count treatment.
That distinction is particularly important when financing and share issuance affect comparisons. The central question is whether growth in the business produces a corresponding improvement in earnings and cash generation for each share. A growing balance sheet supplies an opportunity, while disciplined deployment determines its economic value.
The company completed a one-for-five reverse split effective August 3. The price chart starts on that date to keep the displayed series on the post-consolidation share basis. Exchange corporate-action notice
The latest price and the completed-session setup
The latest exchange quote was $16.05, +4.02%, at Nov 13, 2026 10:52 AM ET. This is an intraday reading from November 13. The compatible 52-week trading range was $3.06–$17.42, placing that quote 90.5% of the way from the low to the high.
The latest completed-session close, on November 12, was $15.43, with a +5.61% daily return and +30.43% five-session return. Its 50-session average was $14.64, with price +5.42% relative to that average. The chart uses those completed closes. Annual-range position measures where a price sits between its extremes, while the weekly return measures change over time.
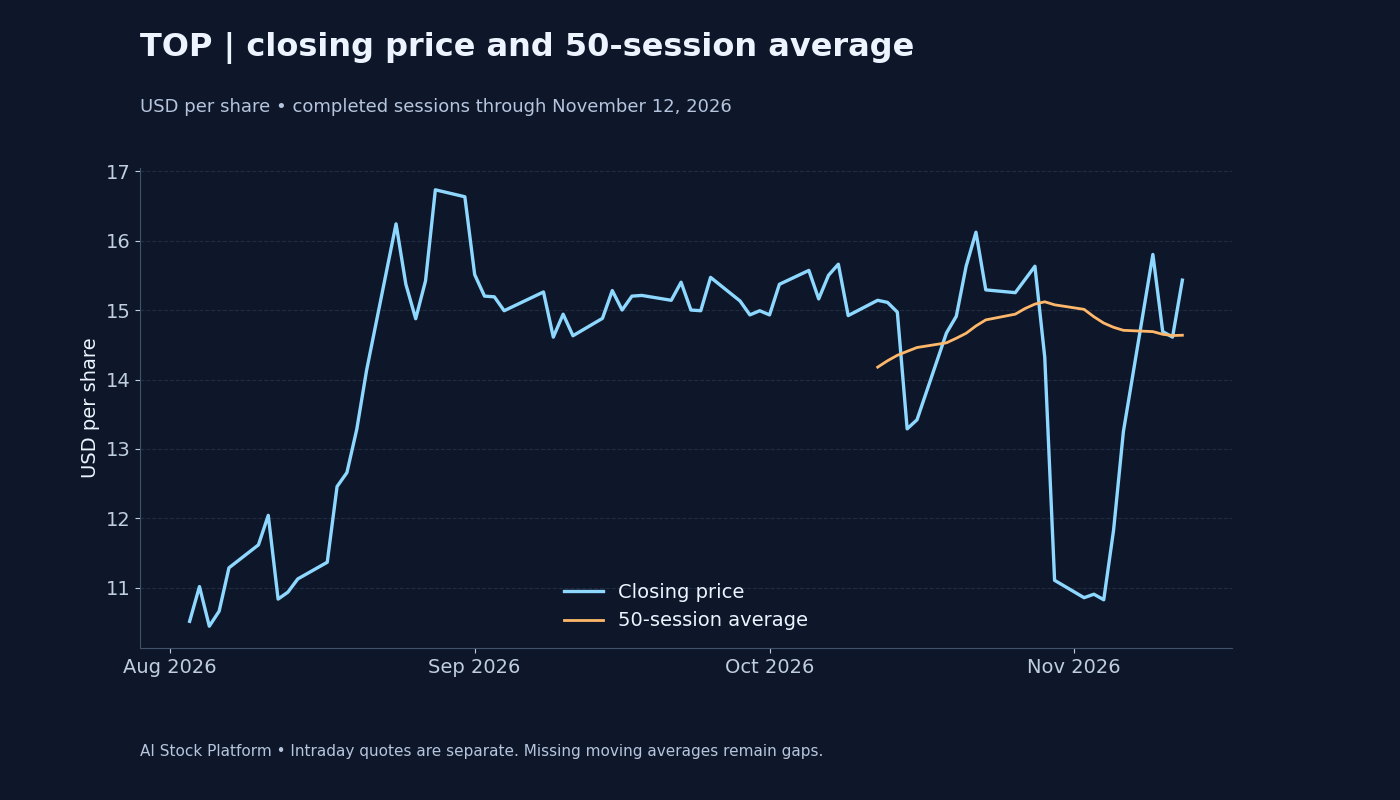
TOP is already near the upper end of the annual range, making it a momentum-led expansion candidate. The completed-session weekly advance is substantial. Holding a higher price while earnings scale would strengthen the thesis, whereas a reversal on limited liquidity could quickly unwind recent gains.
Reading the three research signals
The November 12 Price Score was 3.60/5, changing -0.28 points from November 11. Momentum V3 was 51.44/100, changing -1.15 points. The AI Score history for November 12 recorded 2.41/5.
Price Score currently combines weekly-return points, inverse distance from the 50-session average, industry sentiment, inverse annual-range position and rank movement. Its recovery-oriented design can favor a beaten-down share. Momentum describes price-feature strength, while AI Score adds a separate model view. Their different purposes explain why a constructive company catalyst can arrive alongside mixed historical signals. Friday’s live movement will enter subsequent completed-session measurements. Score methodology
Brokerage peers provide a useful commercial reference
Futu and UP Fintech provide useful comparisons for digital brokerage activity, customer engagement and transaction sensitivity. Their size, licensing footprint and revenue mix differ from TOP’s, so direct multiple comparisons need compatible accounting and business definitions. Watching client activity, recurring revenue and operating cash conversion across the group is a useful first comparison. Futu UP Fintech
The strongest growth businesses retain customers through changing market conditions. That makes repeat usage, funding costs and operating discipline important alongside periods of elevated trading activity. TOP’s expansion creates several potential revenue drivers, but a clearer record of recurring earnings would make the opportunity easier to value across different market environments.
The next catalyst needs operating substance
A confirmed customer announcement, stronger financial release or measurable progress on the planned technology operations could add substance to the growth case. An exact next earnings-call date was unconfirmed at the research cutoff. The absence of a dated call makes company announcements and subsequent regulatory filings the practical sources for the next milestone.
The main supporting factors are the wider product opportunity and the recent improvement in quarterly revenue. The principal inhibitors are credit exposure, funding needs, dilution, regulatory execution and thin trading liquidity. A wide bid-ask spread can make realized trade prices differ meaningfully from the latest displayed quote.
For the coming weeks, TOP offers an identifiable expansion opportunity with a demanding earnings hurdle. A stronger assessment would require evidence that new activities generate durable profit and cash flow. The existing price momentum makes the company worth following, while the scale of future business delivery will determine whether the higher valuation gains lasting support.