
Key takeaways
- The selected index gained 2.17%, but remained 5.20% below its 50-DMA.
- The broader member basket gained 1.07%, with 48.81% of eligible stocks above their own averages.
- Palo Alto Networks reports after the November 18 close; its 4:30 p.m. ET webcast is confirmed, its outcome is not.
Cloud and cybersecurity businesses address durable needs, but their share prices also reflect the price customers will pay and the cash required to deliver growth. A good product does not insulate a stock from a weaker enterprise-spending cycle.
An improving group can create room for several companies to advance, while rising delivery costs can offset strong demand. The next opportunity is best judged by combining that industry backdrop with contracts, margins and cash conversion.
What the completed week shows
The published industry index returned +2.17% between the November 6 and November 13 closes, placing it seventh of the 15 parent industries for the reviewed week. This includes Monday’s move from the previous Friday; a chart beginning at Monday’s close would describe a different period. The latest index level is 96.99.
Participation provides another view. Among the current above-$1B members with a complete weekly price record, 51 advanced, 32 declined and 1 was unchanged. Their equal-weight mean return was +1.07%. That broader member average is different from the selected 20-stock published index, so the two should not be presented as interchangeable returns.
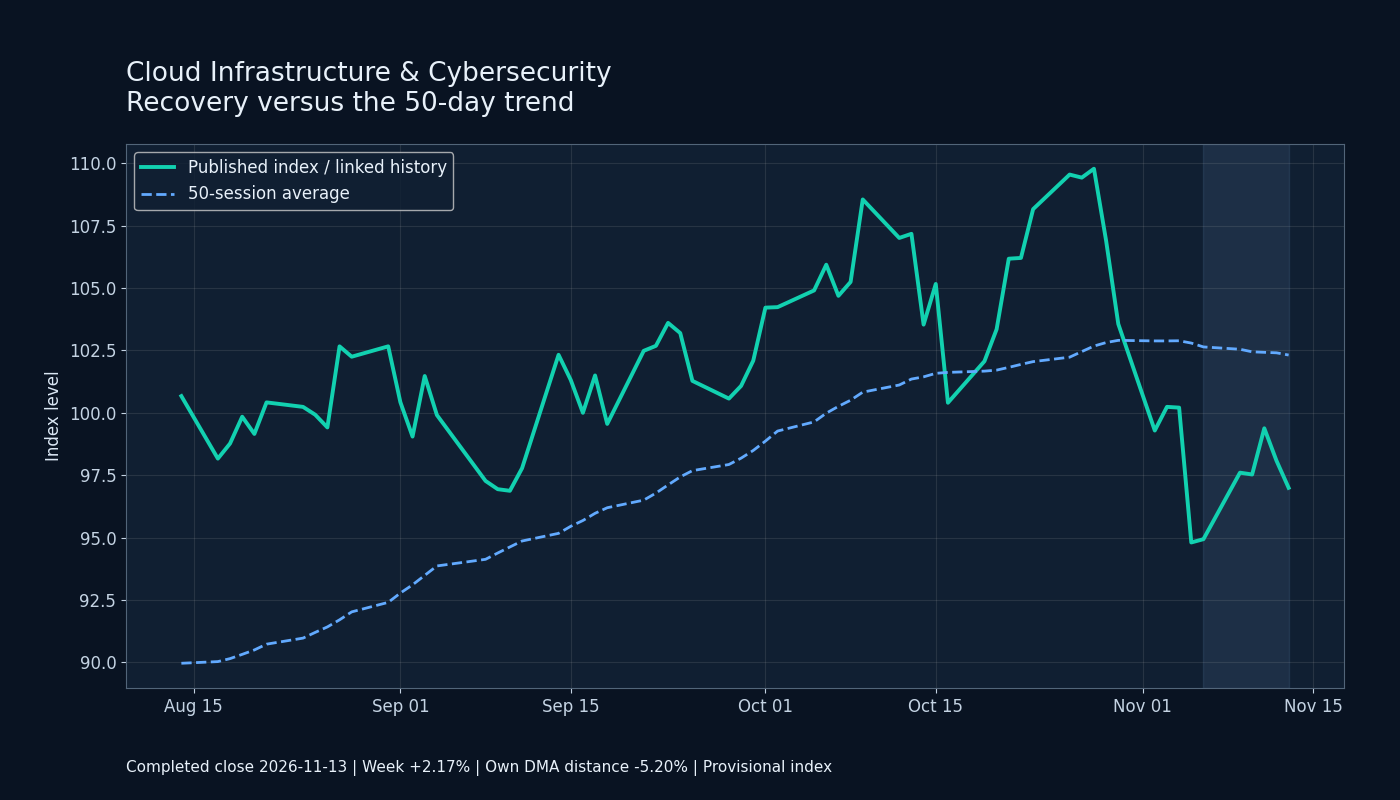
The shaded final week shows the latest move in the context of the longer trend. Linked history and provisional index status remain visible.
What the moving averages reveal
The index ended -5.20% from its own 50-day average of 102.32. Across eligible members with valid individual averages, 48.81% stood above their own 50-day lines. Here, breadth is the share of stocks above their averages; an individual stock’s DMA distance is a different measure. Neither establishes that a business is undervalued.
The technical phase is best described as recovering below 50-DMA. A positive week below the moving average can mark a recovery attempt, while strength above it offers a different starting position. In both cases, follow-through from multiple members matters more than assuming the latest week will repeat.
Where the subindustries differ
Cloud Infrastructure & Cybersecurity
Its fixed-cohort proxy returned +1.07%, using 84 of 85 eligible members with complete weekly closes. Orders, earnings execution and cash conversion still need company-level confirmation. A broad group signal should complement the review of individual financial results.
The proxy is -5.54% from its own 50-day average, with a strict next-week assessment of 3/5.
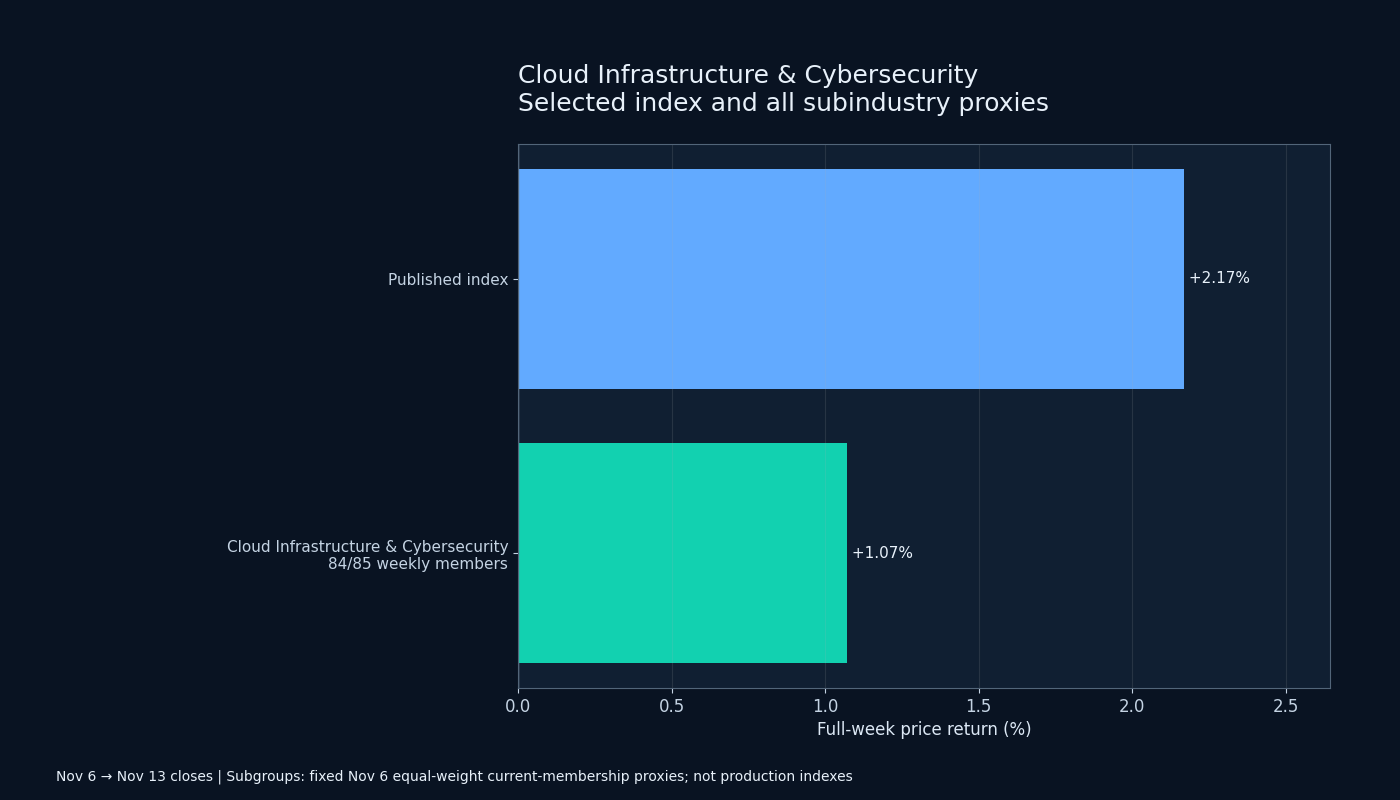
Published index and retrospective subgroup proxies use different baskets. The chart is a comparison of completed returns, not a forecast or a historical investable strategy.
Company evidence and the coming week
Palo Alto Networks scheduled results after the November 18 close and a 16:30 ET webcast. It is a confirmed checkpoint for bookings and margins, while the direction of any subsequent share-price reaction remains unknown.
Within the current industry membership, DOCN (+19.09%), ATEN (+15.75%), CRWV (+14.50%) were among the strongest complete-week returns. At the other end, EVCM (-22.99%), IQMX (-14.14%), BBAI (-13.96%) illustrate the dispersion. These are retrospective company examples, not a claim that they caused the index move or were selected before it occurred. Their returns use saved platform closes, not live weekend quotes.
The current public Real-Money roster also includes Nexxen International Ltd. (NEXN), grouped in this industry. Its latest stored close is $10.32 on 2026-11-13. This connects the industry outlook to a live portfolio holding; the completed-week industry and stock examples above are historical context, not performance earned by a newly selected portfolio. For Nexxen, advertising-platform demand and cash conversion differ from the cybersecurity bookings measured at Palo Alto Networks.
A practical next-week assessment
The parent’s strict next-week assessment is 3/5, a mixed trend reading rather than a predicted return. It gives 60% weight to the technical assessment and 40% to the researched event balance. The technical portion combines weekly-return bands and distance from the industry’s own 50-day line equally. The event balance is 3/5: opposing outcomes have been considered, rather than treating the presence of an earnings date as a bullish event.
The upside case is straightforward: renewals, bookings and conversion improve without sacrificing margins. The downside case is that slower contracts or weaker free-cash-flow guidance expose valuation risk. Confirmation would involve broader participation, a stable or rising own moving average and operating evidence that supports the price move. A failed rebound with fewer stocks participating would weaken that case even if a few individual names remained strong.
The price analysis ends at the November 13 cash close. The latest stored quantitative sentiment was published on November 13 using November 12 prices, so it is older context, not a fresh reading for Monday. Published indexes remain provisional; subgroup estimates retain their separate labels. No fixed industry share of stock returns, unverified fund flows or guaranteed next-week outcome is assumed.