
Key takeaways
- The selected index gained 0.72% and held 6.04% above its 50-DMA.
- Autos lost 1.60% on their broader proxy, contrasting with gains in retail, staples and leisure.
- October retail sales arrive November 17, followed by major retail earnings that can clarify spending and margin trends.
Consumer companies ultimately compete for household budgets. Retailers, hotels, restaurants and vehicle businesses may share a customer, yet financing costs, promotions and travel patterns affect them differently. A good company can struggle when its category loses spending momentum.
An improving group is useful evidence, particularly when several businesses participate. The next step is to compare earnings and price trends with the demand conditions around them, so a recent rebound is not mistaken for a fully repaired investment case.
What the completed week shows
The published industry index returned +0.72% between the November 6 and November 13 closes, placing it 11th of the 15 parent industries for the reviewed week. This includes Monday’s move from the previous Friday; a chart beginning at Monday’s close would describe a different period. The latest index level is 108.87.
Participation provides another view. Among the current above-$1B members with a complete weekly price record, 190 advanced, 133 declined and 1 was unchanged. Their equal-weight mean return was +0.56%. That broader member average is different from the selected 20-stock published index, so the two should not be presented as interchangeable returns.
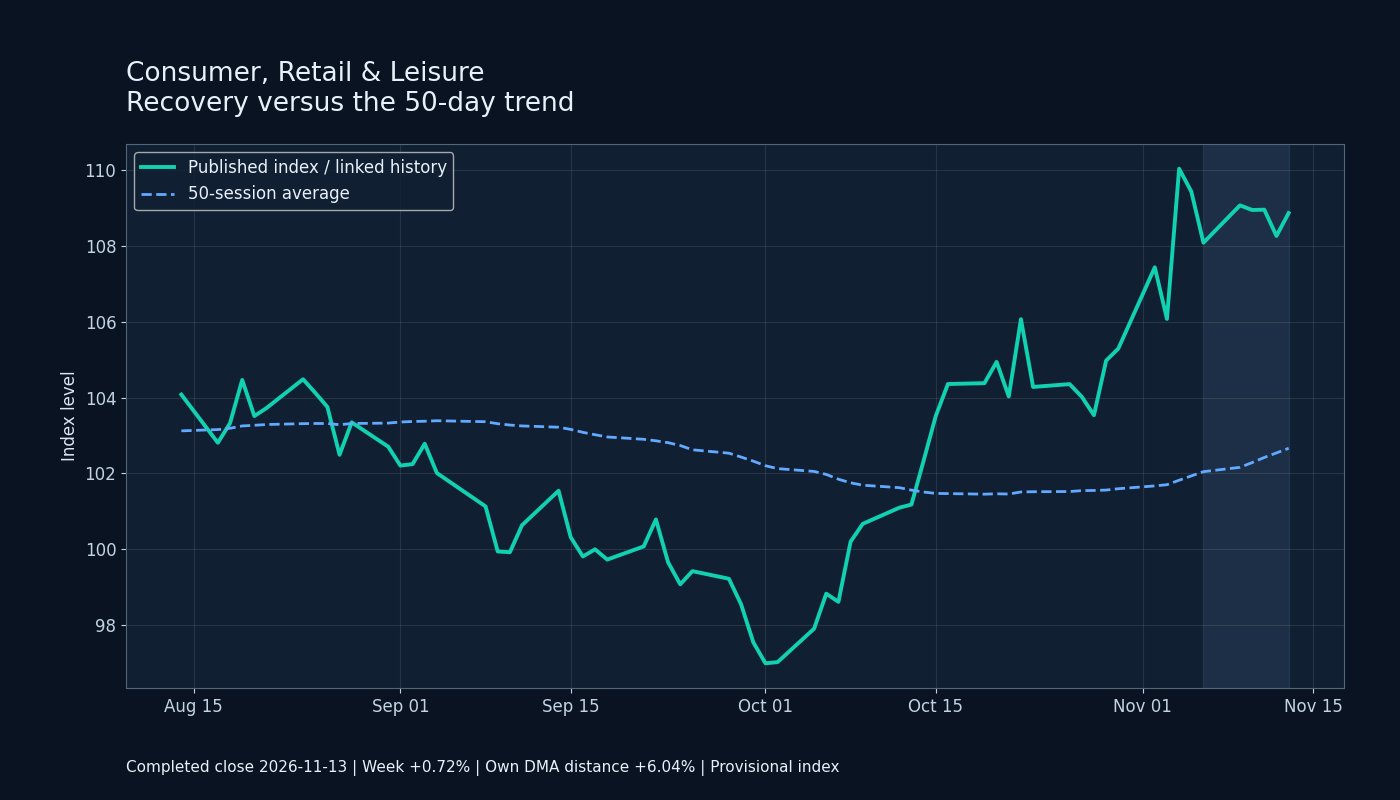
The shaded final week shows the latest move in the context of the longer trend. Linked history and provisional index status remain visible.
What the moving averages reveal
The index ended +6.04% from its own 50-day average of 102.66. Across eligible members with valid individual averages, 68.01% stood above their own 50-day lines. Here, breadth is the share of stocks above their averages; an individual stock’s DMA distance is a different measure. Neither establishes that a business is undervalued.
The technical phase is best described as above 50-DMA; consolidation. A positive week below the moving average can mark a recovery attempt, while strength above it offers a different starting position. In both cases, follow-through from multiple members matters more than assuming the latest week will repeat.
Where the subindustries differ
Auto Manufacturers & Suppliers
Its fixed-cohort proxy returned -1.60%, using 55 of 56 eligible members with complete weekly closes. Vehicle demand, financing costs, parts content and dealership economics need separate checks; faster unit growth need not mean better margins.
The proxy is -5.70% from its own 50-day average, with a strict next-week assessment of 2/5.
Consumer Products & Retail
Its fixed-cohort proxy returned +0.89%, using 103 of 103 eligible members with complete weekly closes. Inventory, promotions and gross margins can matter as much as revenue. A price rebound is stronger when it accompanies healthy sell-through.
The proxy is +5.90% from its own 50-day average, with a strict next-week assessment of 3/5.
Food, Beverages & Consumer Staples
Its fixed-cohort proxy returned +1.11%, using 94 of 96 eligible members with complete weekly closes. Defensive demand can stabilize sales, but consumers can trade down and input costs can pressure margins. Pricing power needs volume confirmation.
The strict 50-day assessment is unavailable because the full frozen weekly cohort lacks a continuous common history. A separately labeled complete-history estimate is 3/5, retaining 93 of 94 weekly members (98.9%). Its weekly return changes by +0.01 percentage points. It excludes sparse-history stocks and may therefore be biased.
Travel, Leisure & Restaurants
Its fixed-cohort proxy returned +1.01%, using 72 of 72 eligible members with complete weekly closes. Bookings, visits and restaurant traffic give different demand signals. Occupancy or attendance gains should be compared with labor costs and realized pricing.
The strict 50-day assessment is unavailable because the full frozen weekly cohort lacks a continuous common history. A separately labeled complete-history estimate is 4/5, retaining 71 of 72 weekly members (98.6%). Its weekly return changes by +0.02 percentage points. It excludes sparse-history stocks and may therefore be biased.
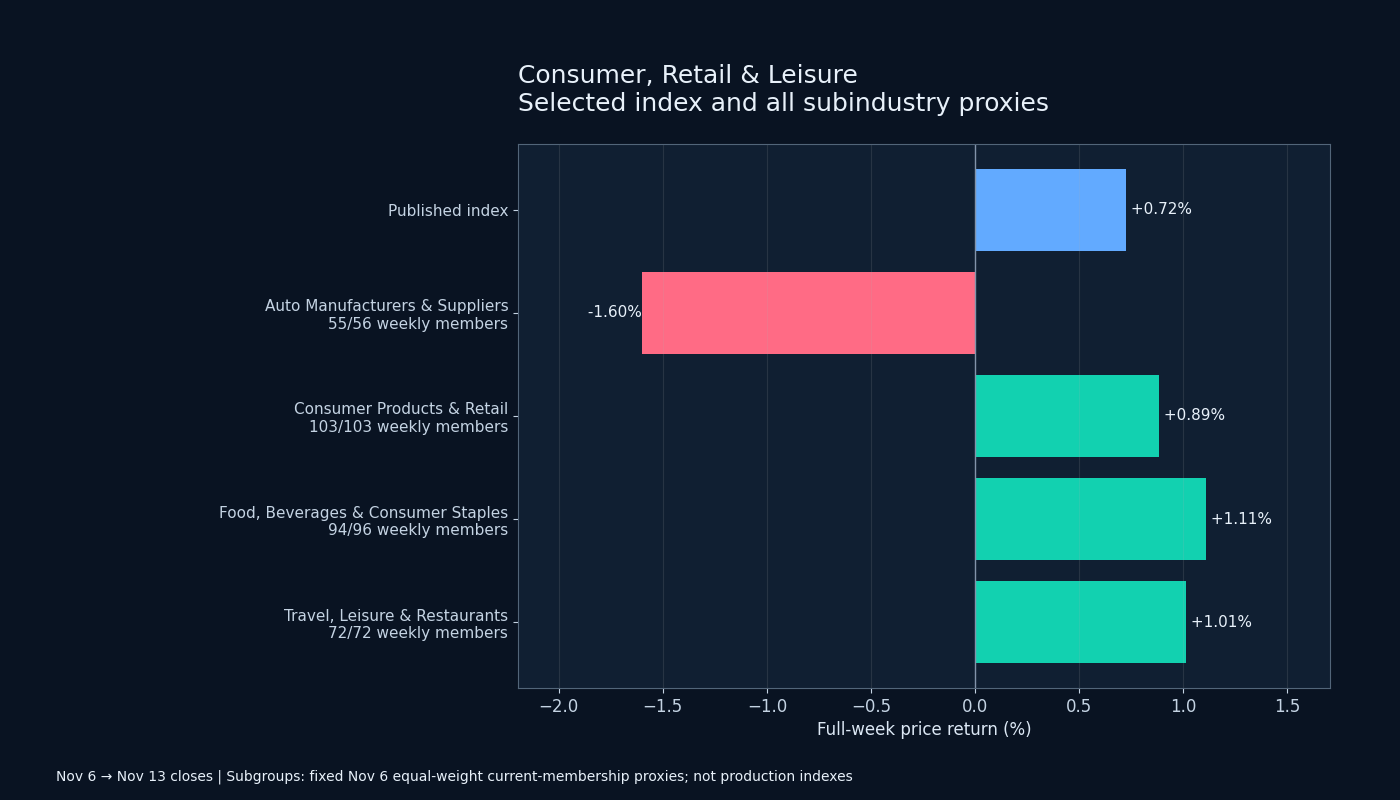
Published index and retrospective subgroup proxies use different baskets. The chart is a comparison of completed returns, not a forecast or a historical investable strategy.
Company evidence and the coming week
The Census release schedule places October retail sales on November 17 at 08:30 ET. Home Depot’s call is at 9 a.m. ET that morning; Target follows November 18 and Walmart November 19. These are demand checkpoints, not verified results or a forecast that every leisure stock will rise.
Within the current industry membership, MOD (+40.42%), SENEA (+16.84%), WWW (+16.69%) were among the strongest complete-week returns. At the other end, PSNY (-23.94%), SLBT (-22.45%), FLO (-17.59%) illustrate the dispersion. These are retrospective company examples, not a claim that they caused the index move or were selected before it occurred. Their returns use saved platform closes, not live weekend quotes.
The current public Real-Money roster also includes Wolverine World Wide, Inc. (WWW), grouped in this industry. Its latest stored close is $24.89 on 2026-11-13. This connects the industry outlook to a live portfolio holding; the completed-week industry and stock examples above are historical context, not performance earned by a newly selected portfolio. For Wolverine, sell-through, inventory and margins offer a more direct operating check than aggregate retail sales alone.
A practical next-week assessment
The parent’s strict next-week assessment is 3/5, a mixed trend reading rather than a predicted return. It gives 60% weight to the technical assessment and 40% to the researched event balance. The technical portion combines weekly-return bands and distance from the industry’s own 50-day line equally. The event balance is 3/5: opposing outcomes have been considered, rather than treating the presence of an earnings date as a bullish event.
The upside case is straightforward: volumes and guidance show resilient discretionary spending. The downside case is that price-sensitive consumers, promotions and financing costs weaken margins. Confirmation would involve broader participation, a stable or rising own moving average and operating evidence that supports the price move. A failed rebound with fewer stocks participating would weaken that case even if a few individual names remained strong.
The price analysis ends at the November 13 cash close. The latest stored quantitative sentiment was published on November 13 using November 12 prices, so it is older context, not a fresh reading for Monday. Published indexes remain provisional; subgroup estimates retain their separate labels. No fixed industry share of stock returns, unverified fund flows or guaranteed next-week outcome is assumed.